HexPoint
Financial Analytics Platform
Power tools for serious investors.
Comprehensive stock screening, macro-economic analysis, and financial statement visualization. Advanced data analytics and market insights for informed investment decisions.
Manage your investments with confidence
Track portfolios, import transactions, and monitor performance in real-time
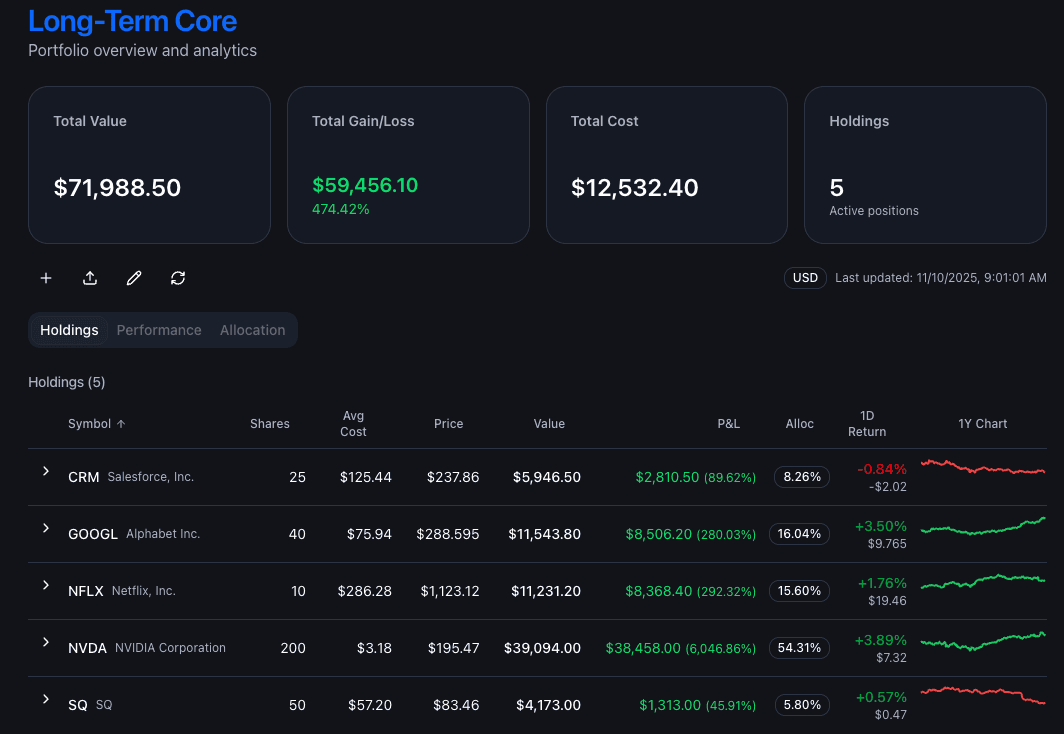
Track your investments with precision
Build and monitor multiple portfolios with real-time performance tracking. Analyze your holdings, track gains/losses, and optimize your asset allocation with comprehensive analytics.
- Multiple portfolio support with real-time valuations
- Performance metrics and attribution analysis
- Sector allocation and diversification insights
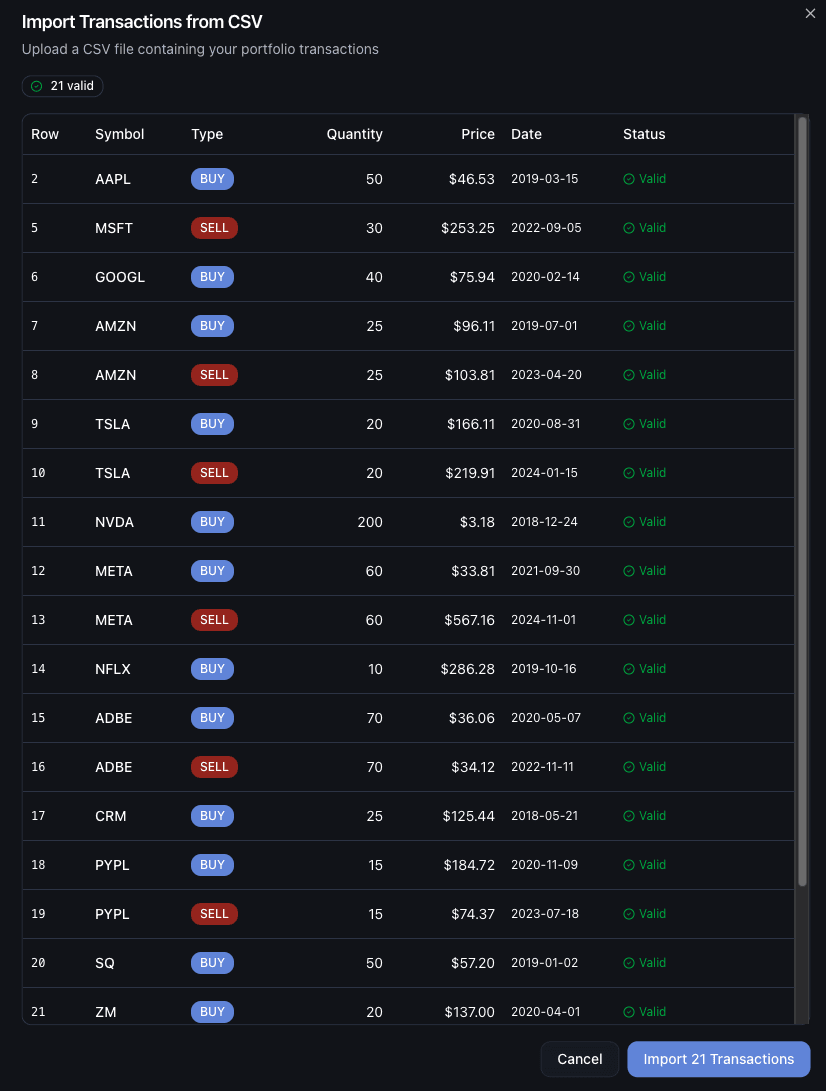
Import your transaction history instantly
Bring your existing investment data into HexPoint with simple CSV imports. Upload transaction history from your broker and start tracking performance immediately.
- Import transactions from any broker via CSV
- Automatic symbol recognition and validation
- Bulk upload for portfolios of any size
Discover and analyze investment opportunities
Advanced screening and visualization tools for data-driven decisions
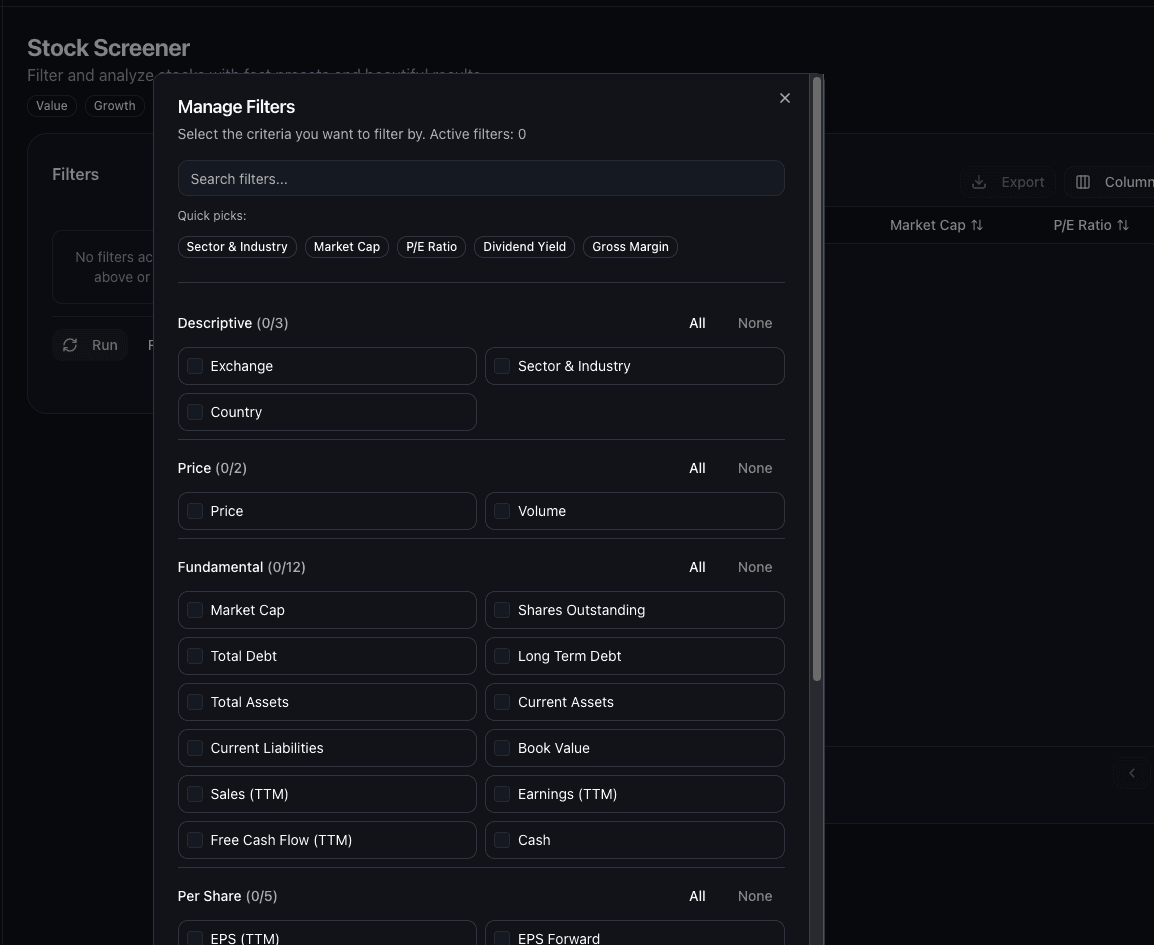
Filter thousands of stocks in seconds
Screen the entire market with advanced filters including valuation metrics, growth rates, profitability ratios, and technical indicators. Save custom screens and get instant results.
- 50+ fundamental and technical metrics
- Real-time market data and pricing
- Export results to CSV for further analysis
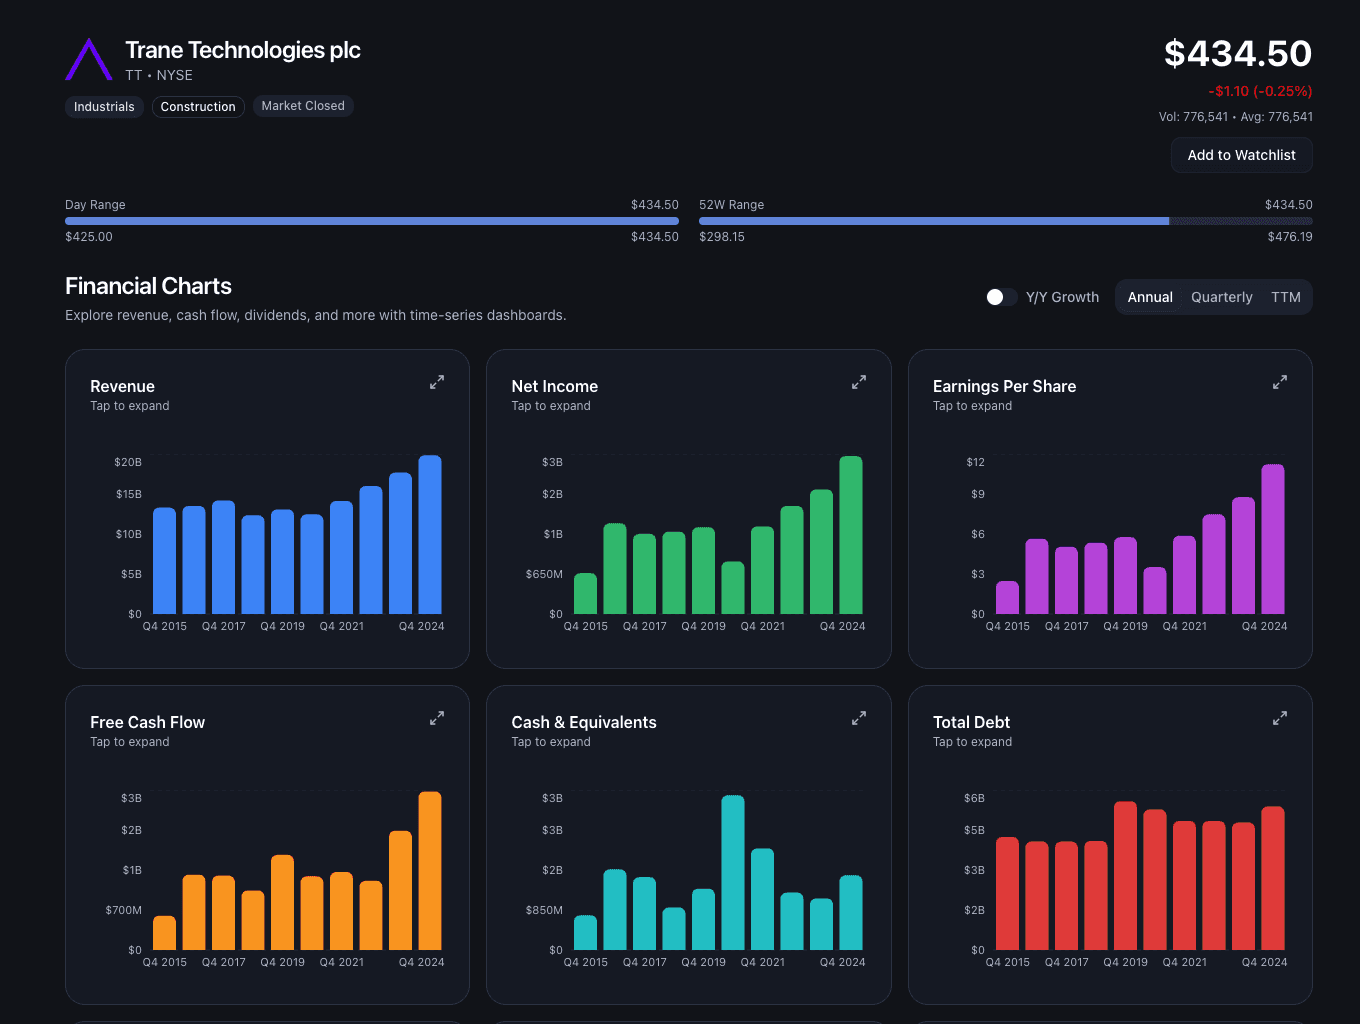
Visualize complex financials effortlessly
Transform dense financial statements into clear, interactive visualizations. Track trends over time, compare metrics, and identify patterns that matter.
- Interactive charts for income, balance sheet, and cash flow statements
- Historical trends spanning 10+ years
- Customizable views and time periods